Project information
- Category: Data Science
- Project URL: Github
Exploratory Data Analysis (EDA)
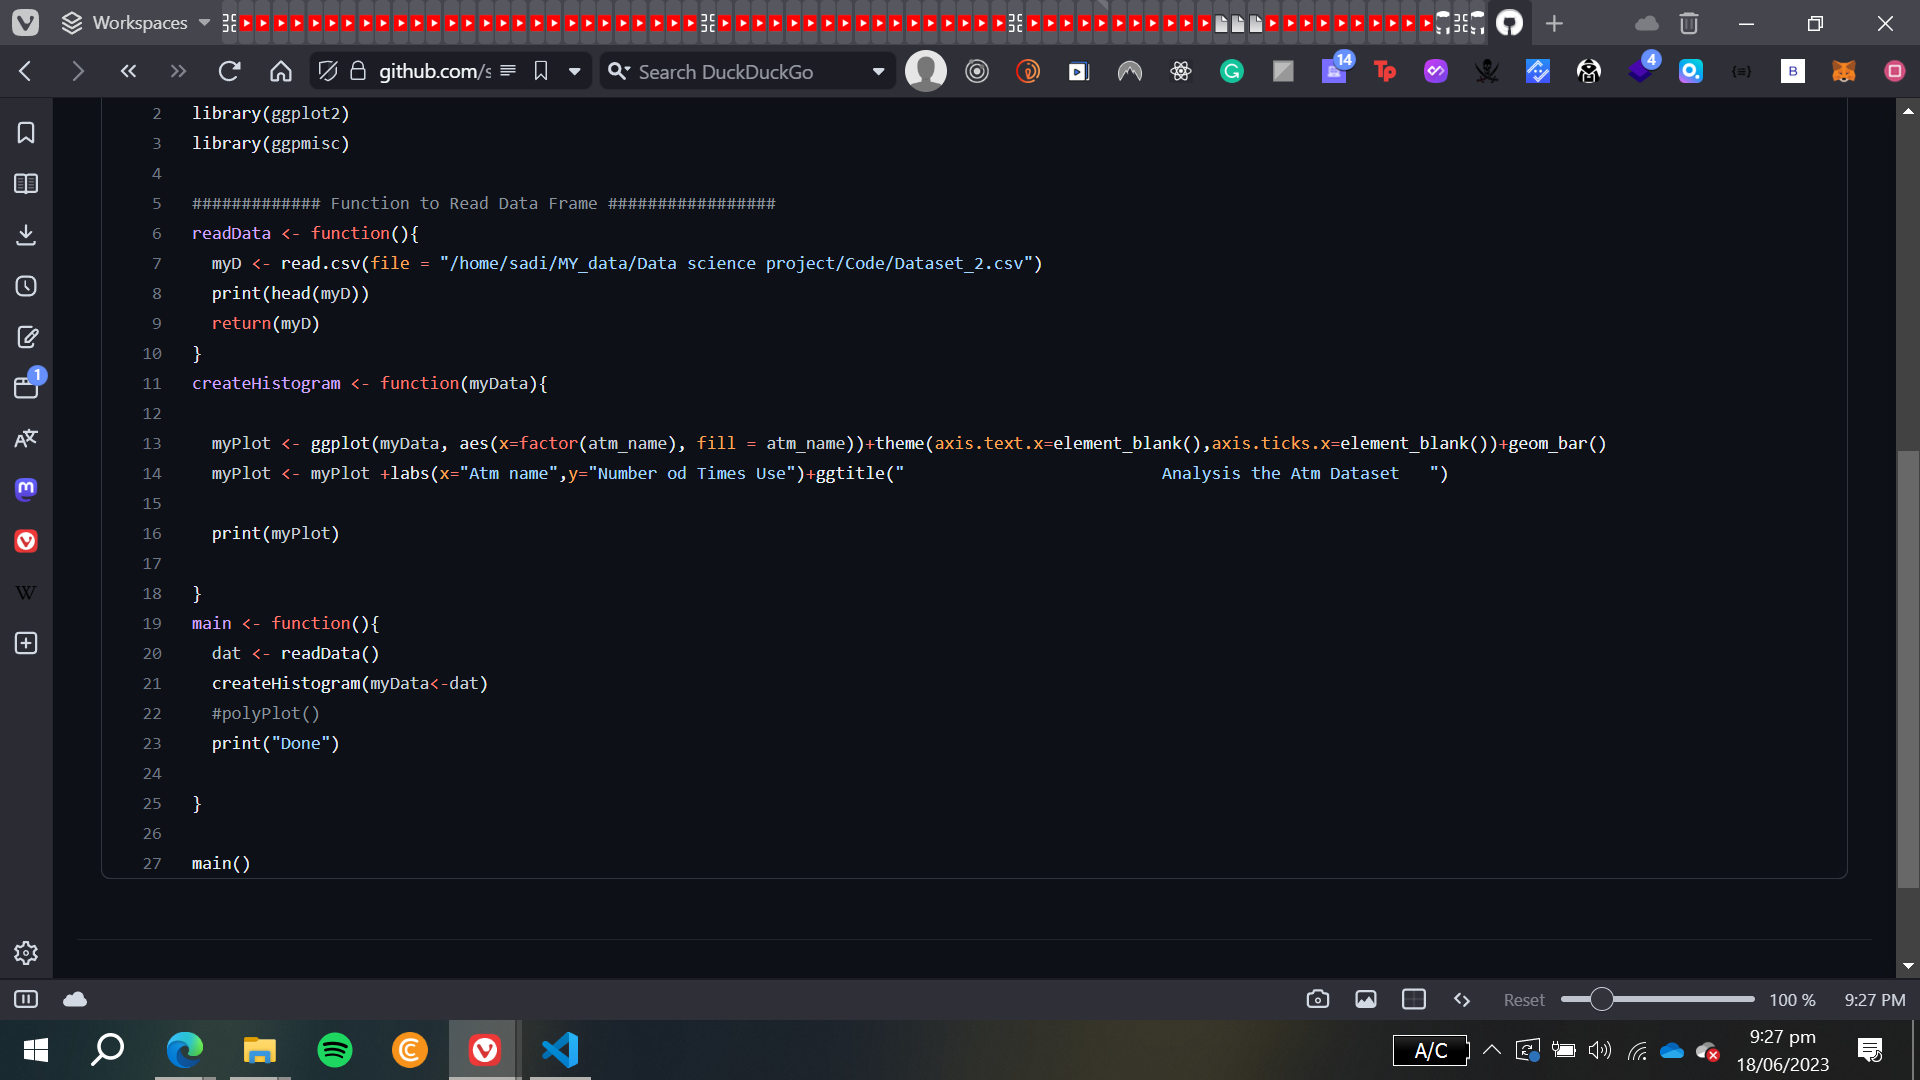
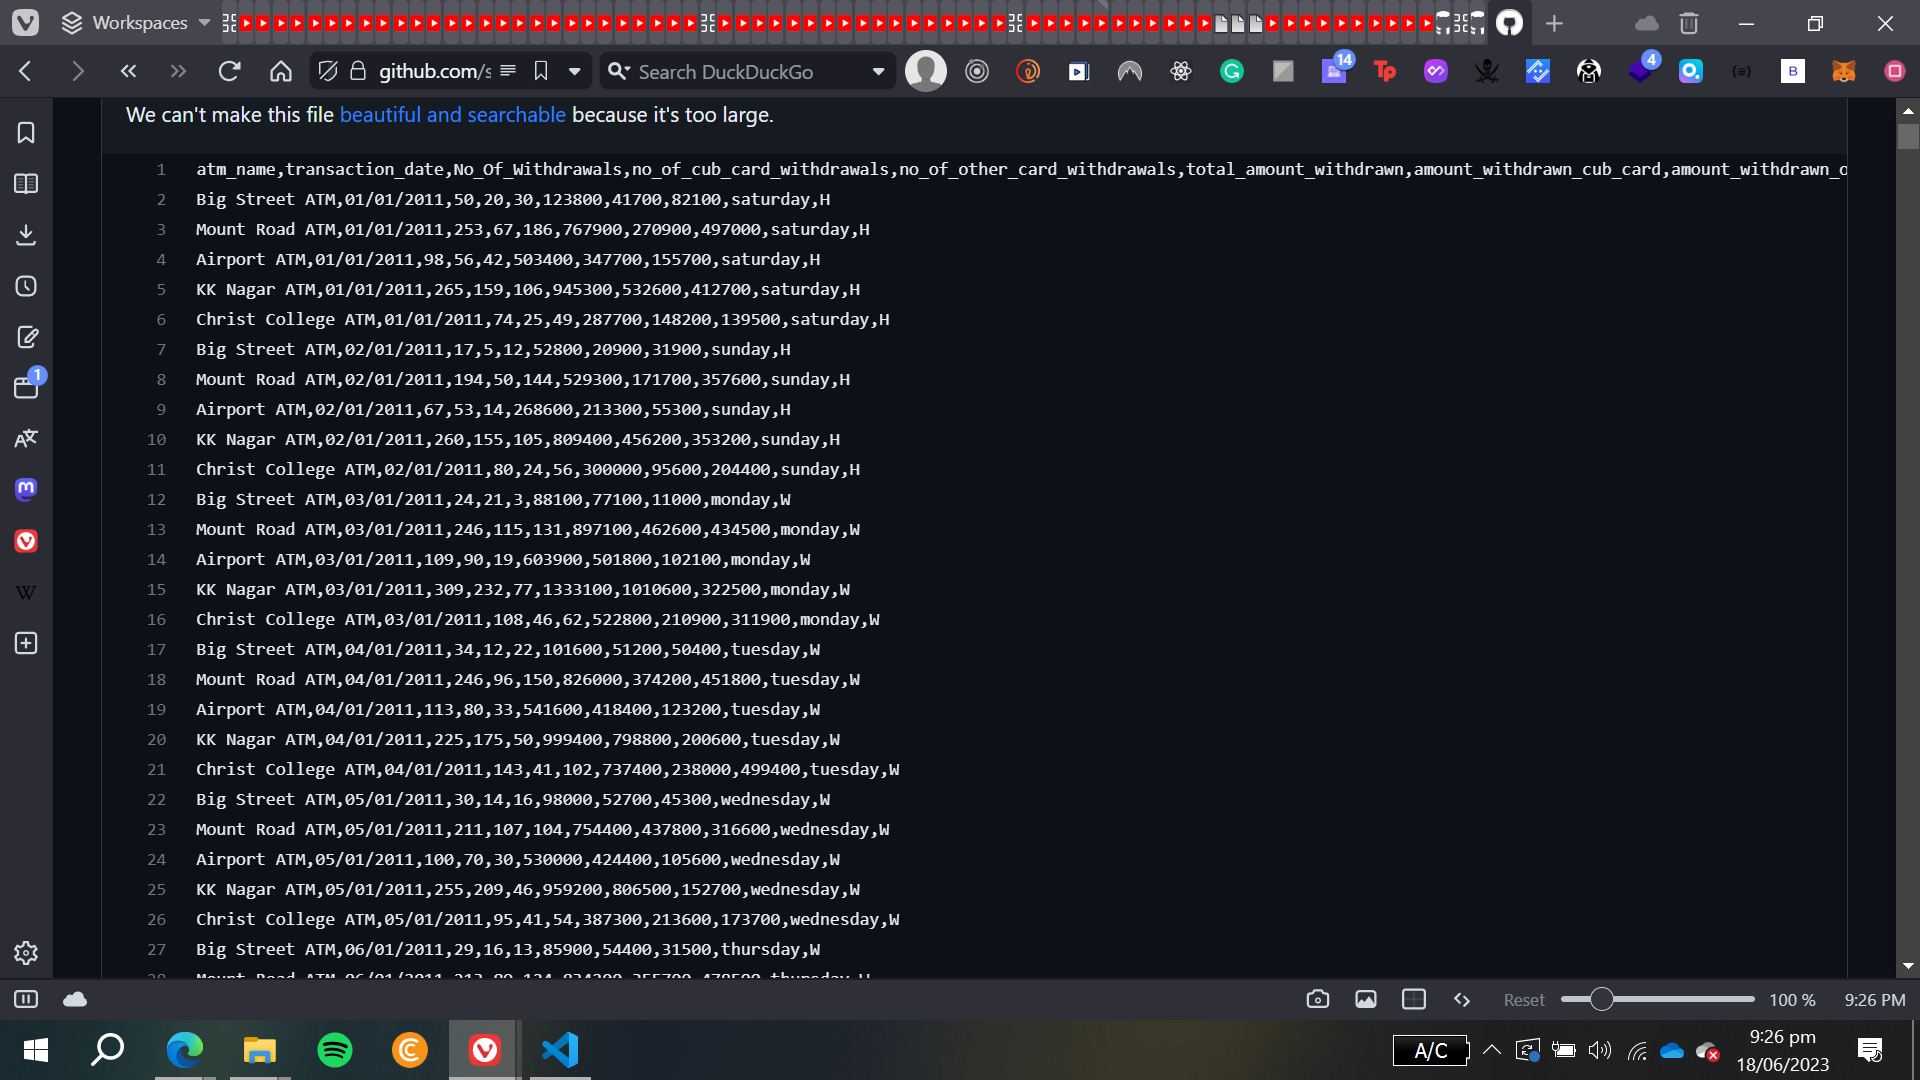
Instructions: If your registration number is ODD, then you will work on Dataset_1 otherwise on Dataset_2. You need to perform Exploratory Data Analysis (EDA) on the given dataset. Your aim should be to explore and analyze the data using all the methods / techniques you have learned for EDA. You should draw at least 5 graphs and explain those graphs in detail. (Ref: Lecture 11 delivered on May 07, 2021). This is the minimum number of graphs needed, in principle, you should draw as many as graphs as required to fully explore / explain the data. While explaining the graphs, follow the instructions / examples given in Lecture 11, May 07, 2021. You need to write a report for this purpose. In the report, you will add all the graphs as Figures (e.g, Figure 1, Figure 2 etc.) and then explain the Figure / Graph. (For reference, you can see the attached PDF file, EDA.pdf) Your report should not exceed 15 pages including the title page. On the title page, you must mention your Name and Registration number. You can use MS Word for writing the report and then convert it to a PDF file. The name of the PDF file should be your registration number in the format 2018CS000. (If you fail to follow this format, you will lose marks). All the graphs should have your registration number as a watermark. Similarly, all the pages of the report should be watermarked with your registration number. Before submitting, make sure that the PDF file can be opened. You can save graphs as PNG or JPEG files and then insert in the Word Document. Both the datasets i.e., Dataset_1 and Dataset_2 are described below.